How to Compare Two Columns in Excel to Find Differences (The Easiest Way)
Today we’ll be talking about how to compare two columns in Excel to find differences and you’ll see the easiest way to quickly check which values are present in one of the columns and which values can be found in both.
Let’s start then!
Would you rather watch this tutorial? Click the play button below!
How to Compare Two Columns in Excel to Find Differences
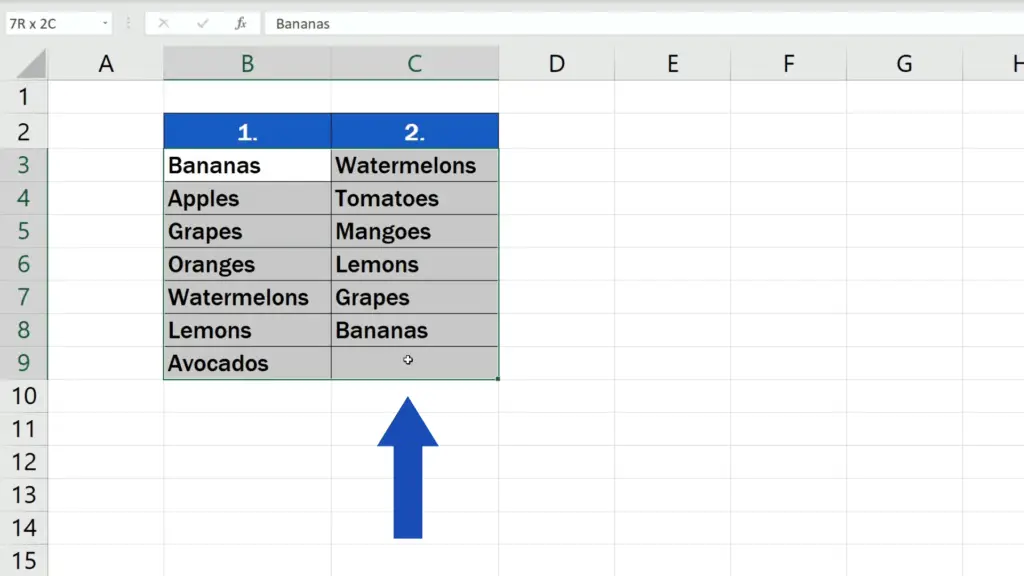
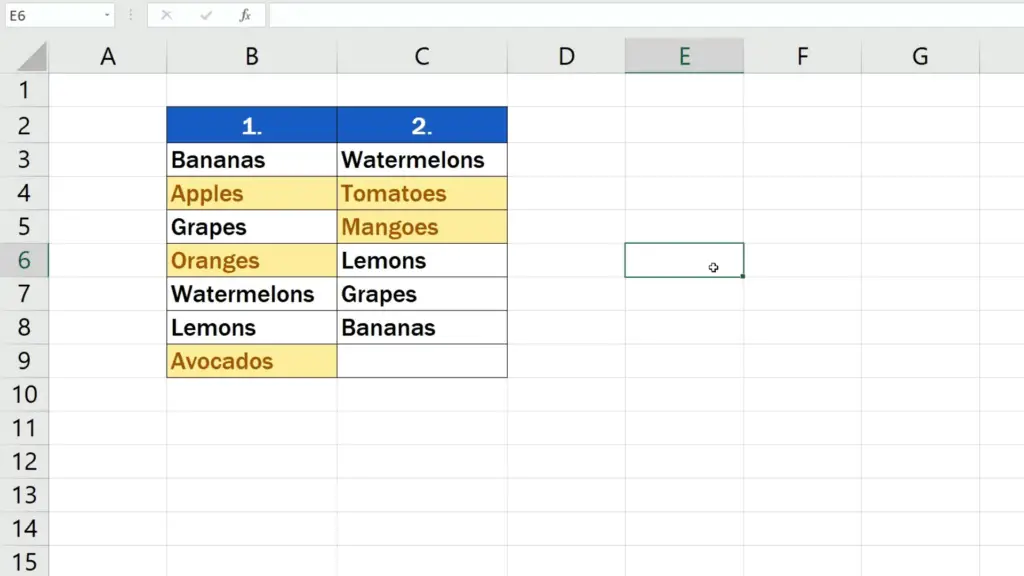
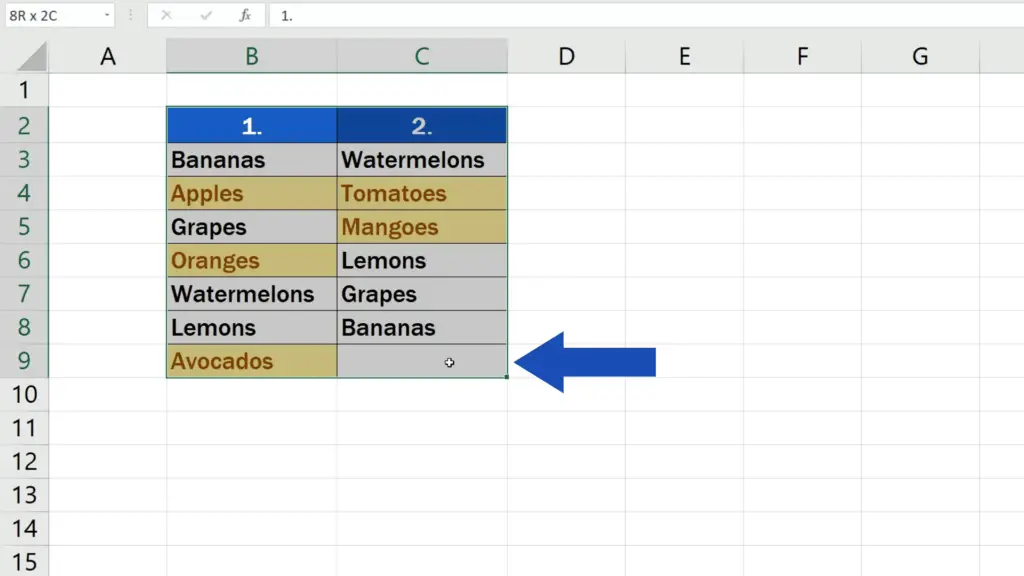
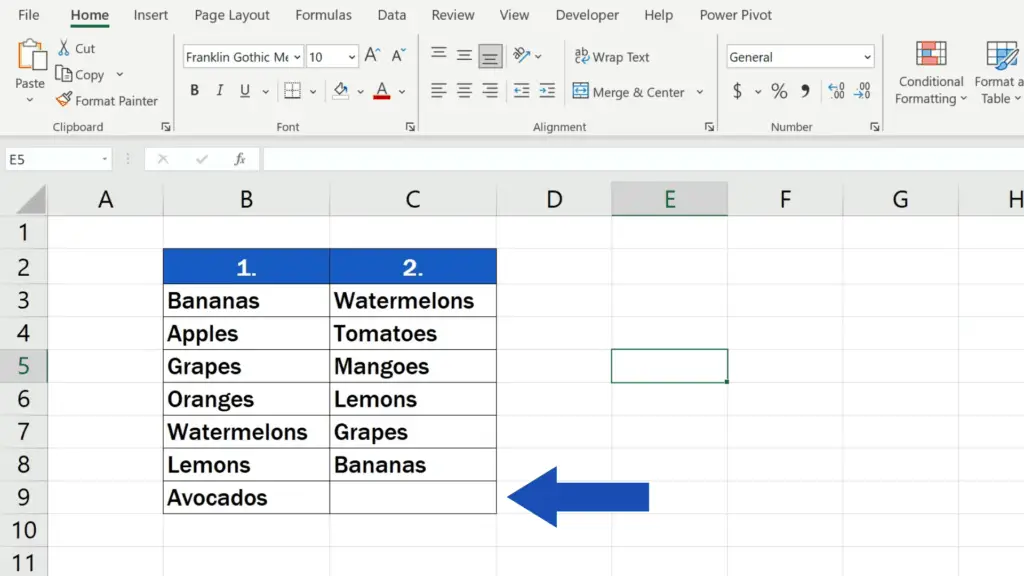
To find differences between the contents of two columns in Excel, we need to select both columns first.
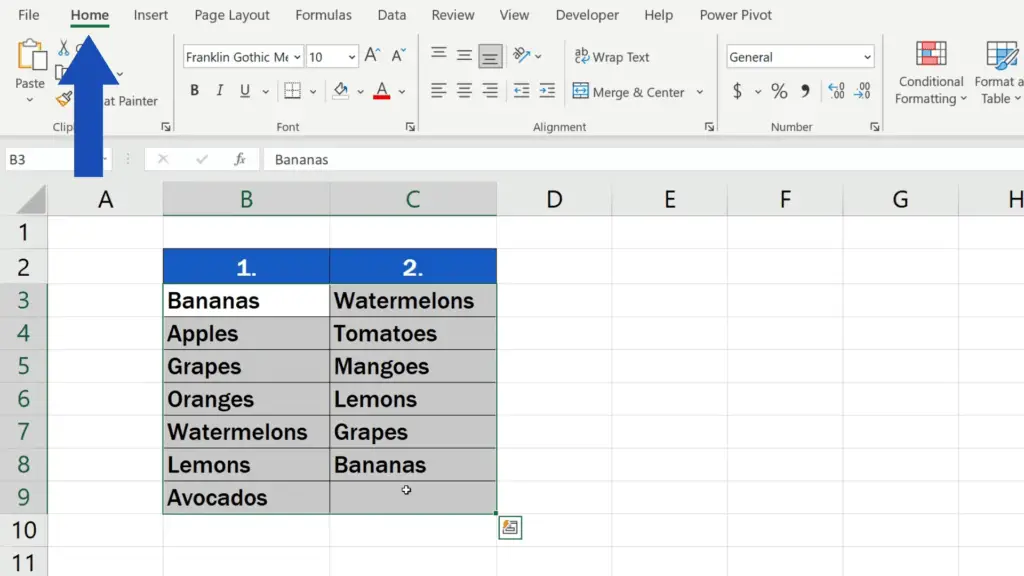
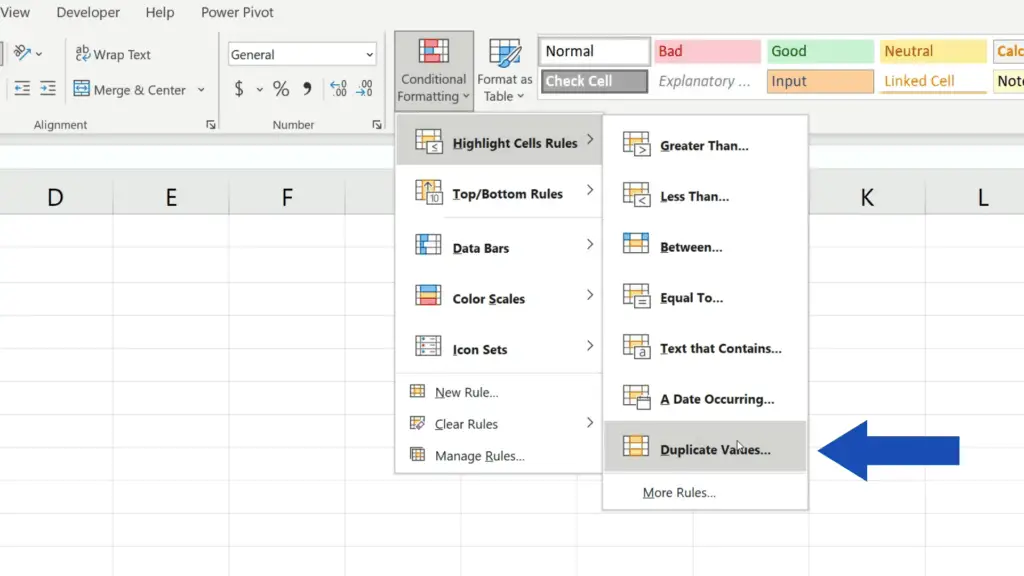
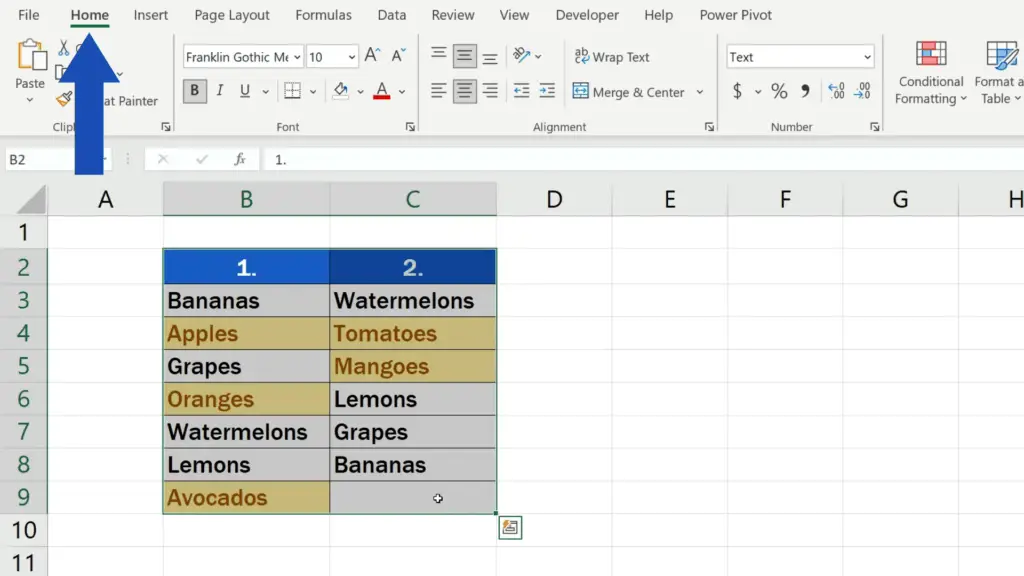
Then we go to the Home tab, click on Conditional Formatting and hover over ‘Highlight Cell Rules’.
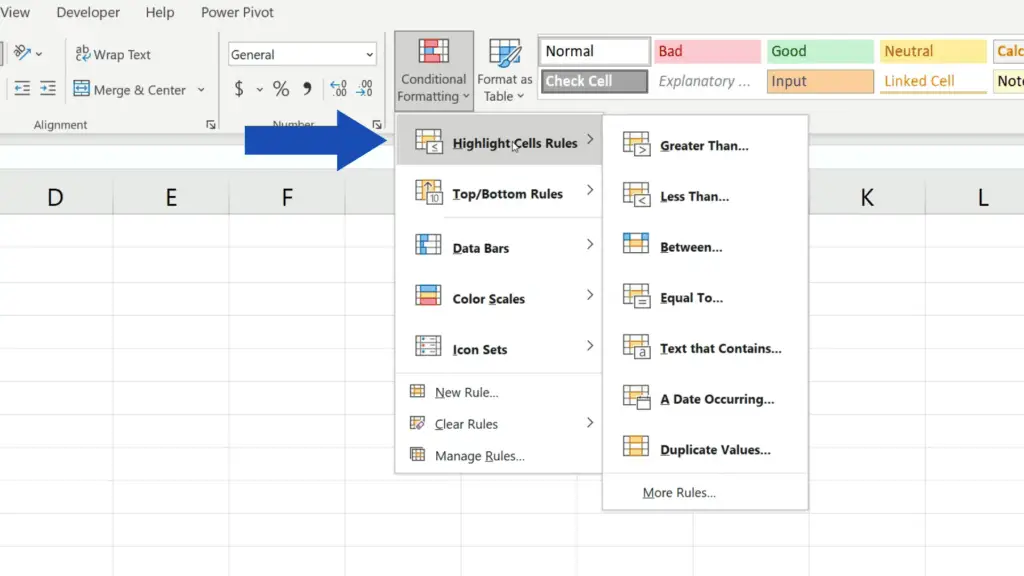
From the options that appeared, we select ‘Duplicate Values’.
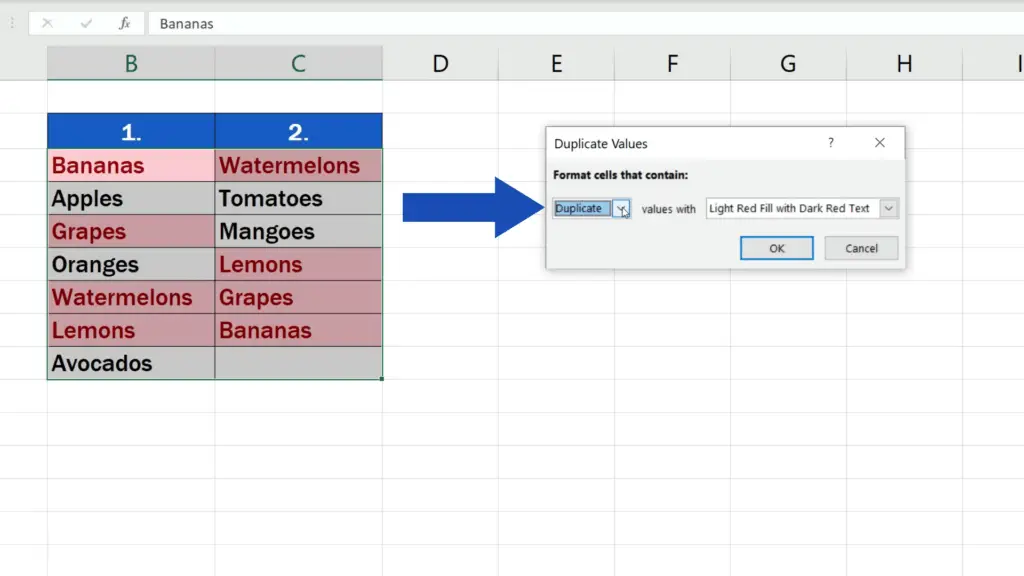
Here in this window, we can choose whether we want to highlight duplicates – the values showing in the selected area twice, or we can choose the option ‘Unique’, which means that Excel will highlight the values that occur in both columns only once.
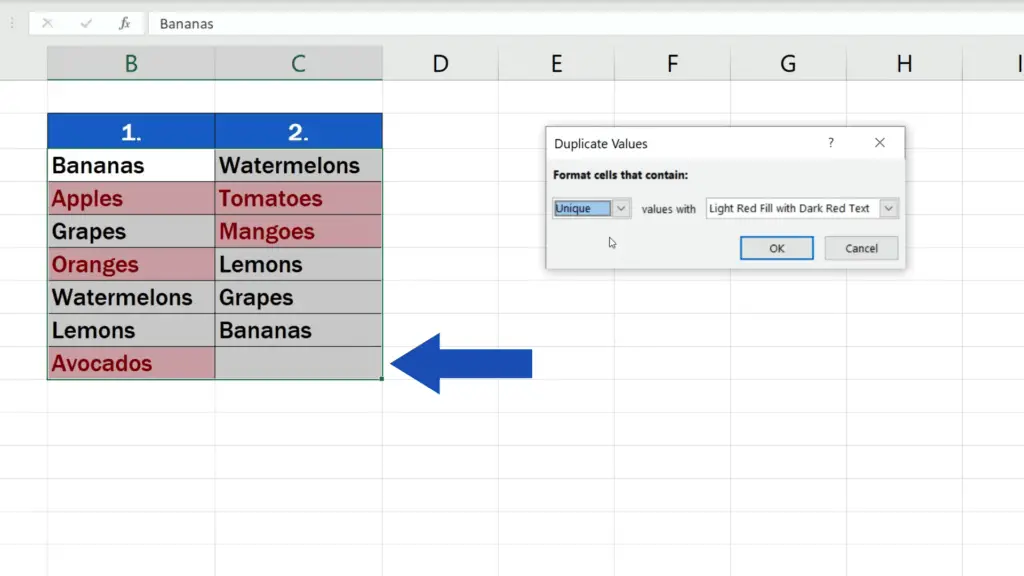
And this is exactly what we want because we can quickly find the differences between the columns in terms of the values they contain. So, we want to highlight the values that are present only in one of the columns.
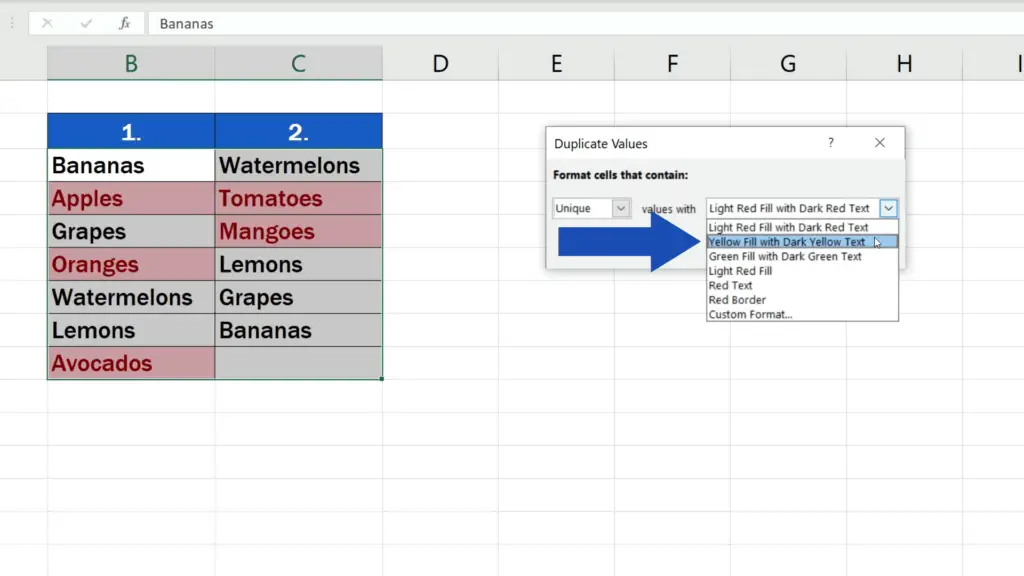
Of course, we can choose the colour we want to use to highlight the values.
Let’s use this option and have the values highlighted in yellow. Confirm, and let’s have a look at other useful tricks that can help you efficiently compare the column contents.
How to Turn on the Filter to Help You Sort the Values
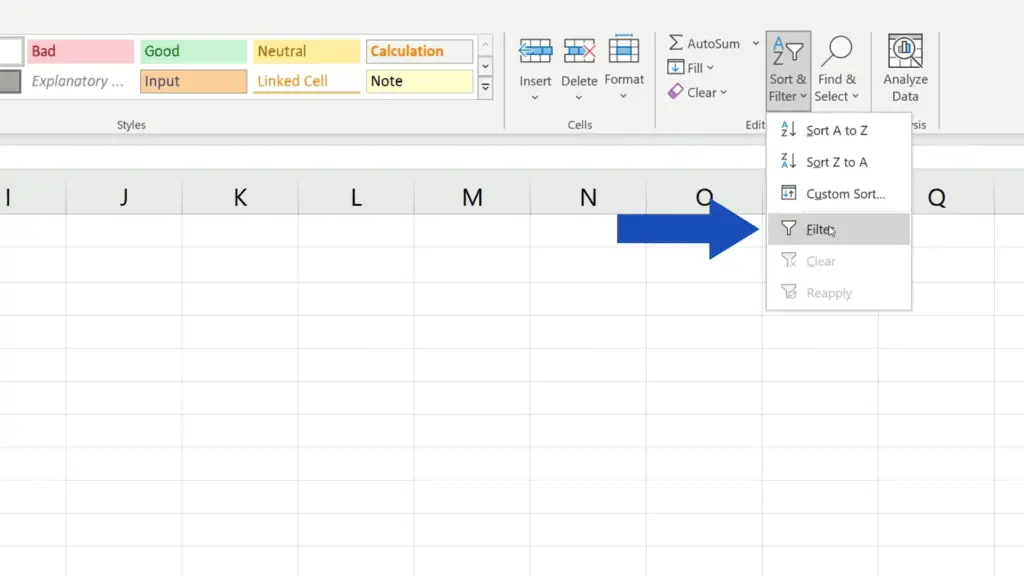
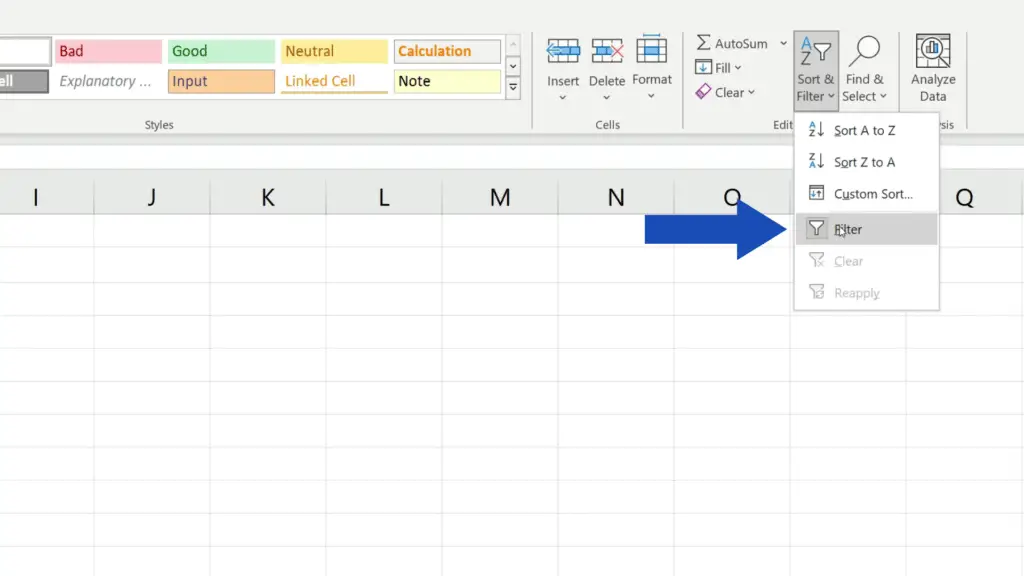
As soon as the unique values have been highlighted, we can turn on the filter to help us sort the values, which might help in further data processing. Select the whole area (header included), go to the Home tab, click on ‘Sort & Filter’ and choose ‘Filter’.
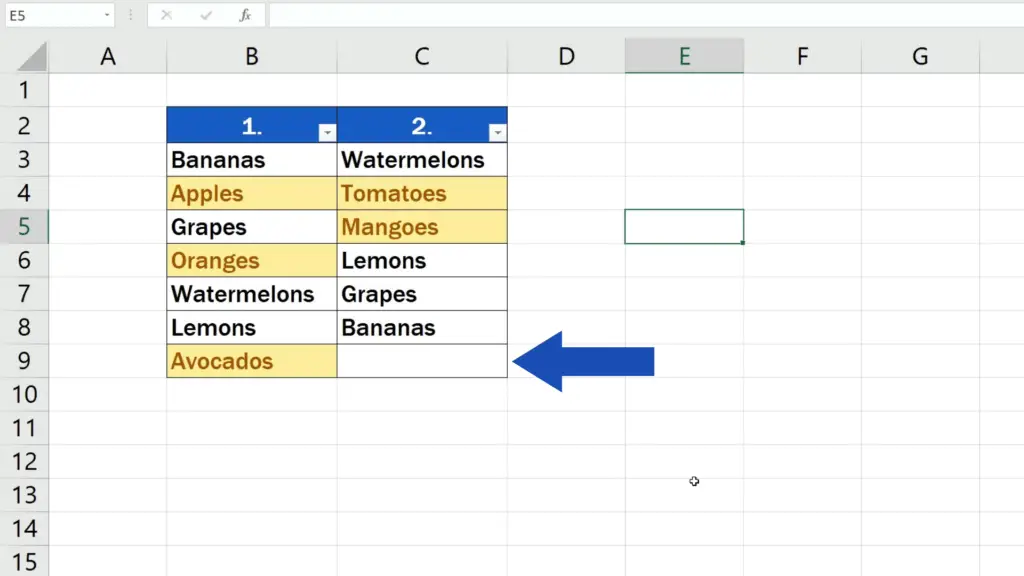
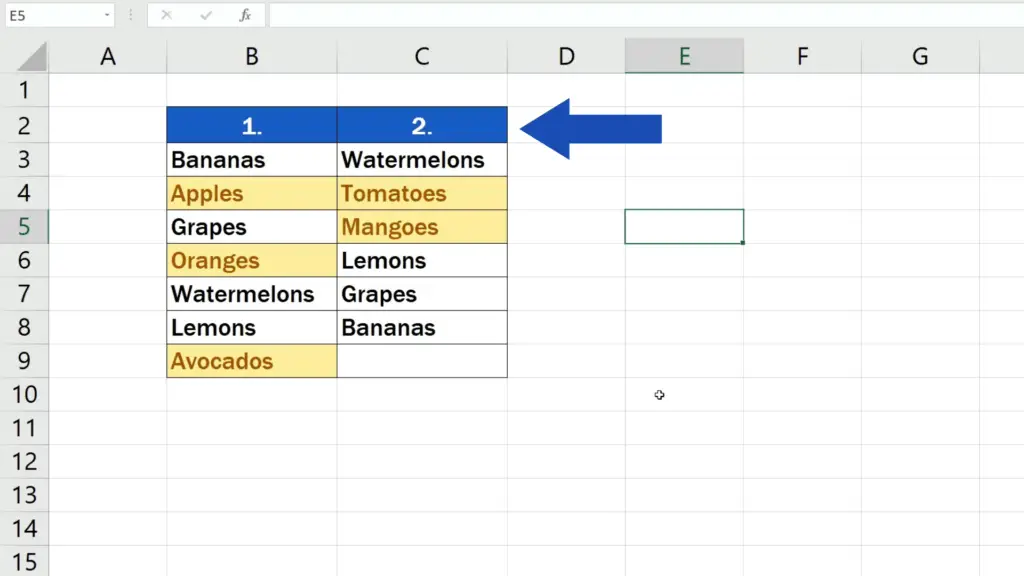
The filter option now shows in the header of both columns and we can conveniently sort the data in a column based on the colour.
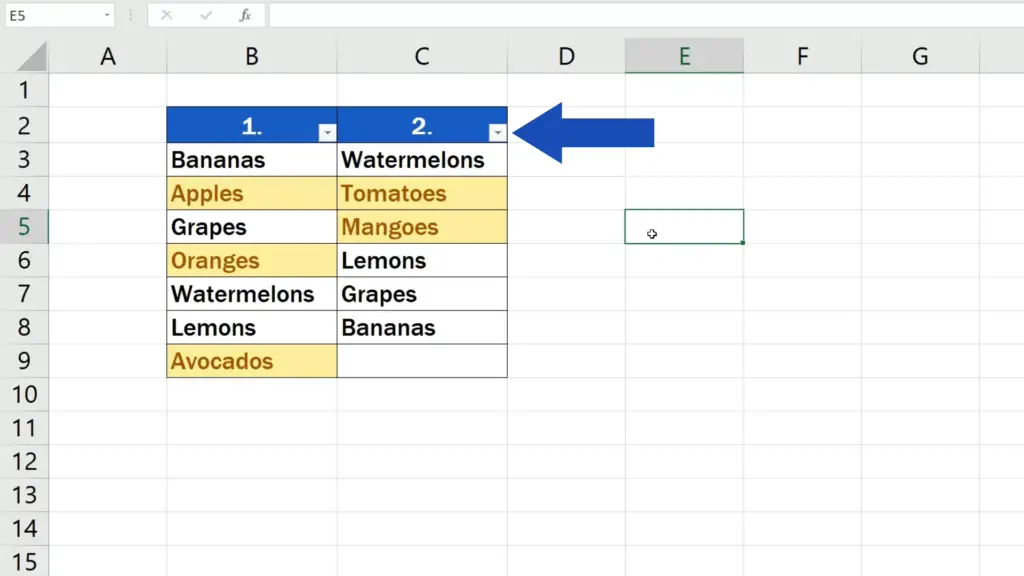
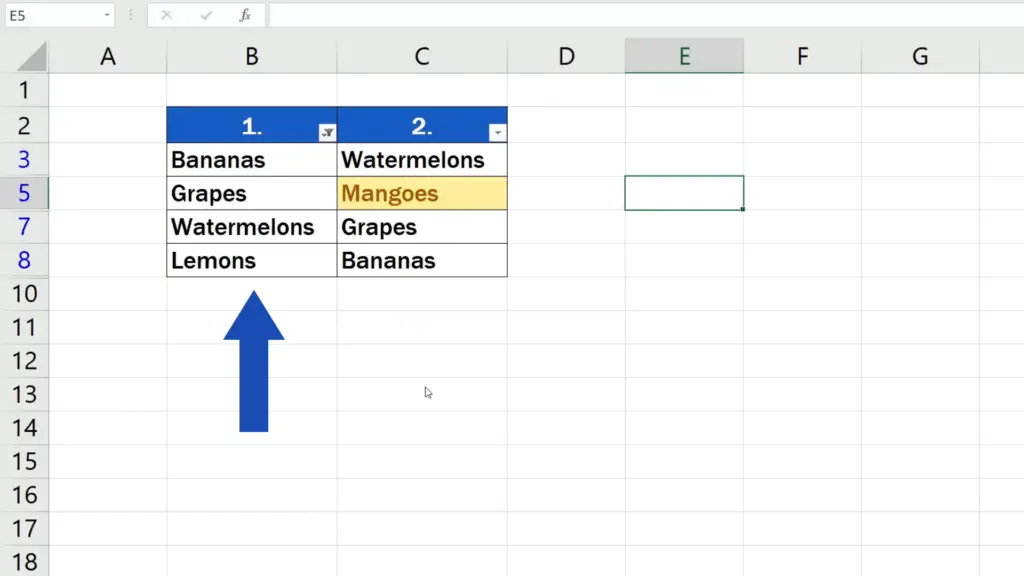
For example, we can display only the unique values in the first column.
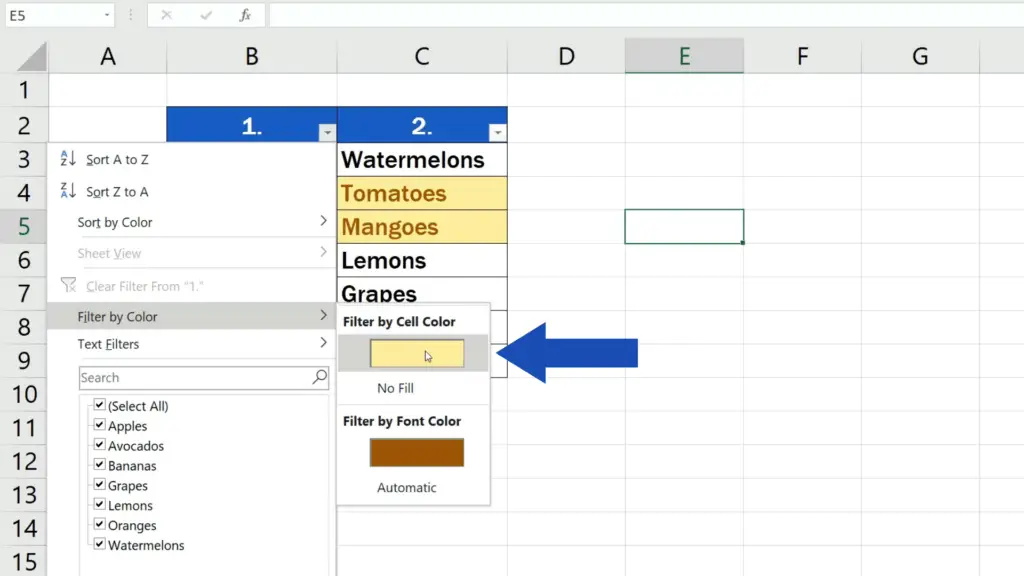
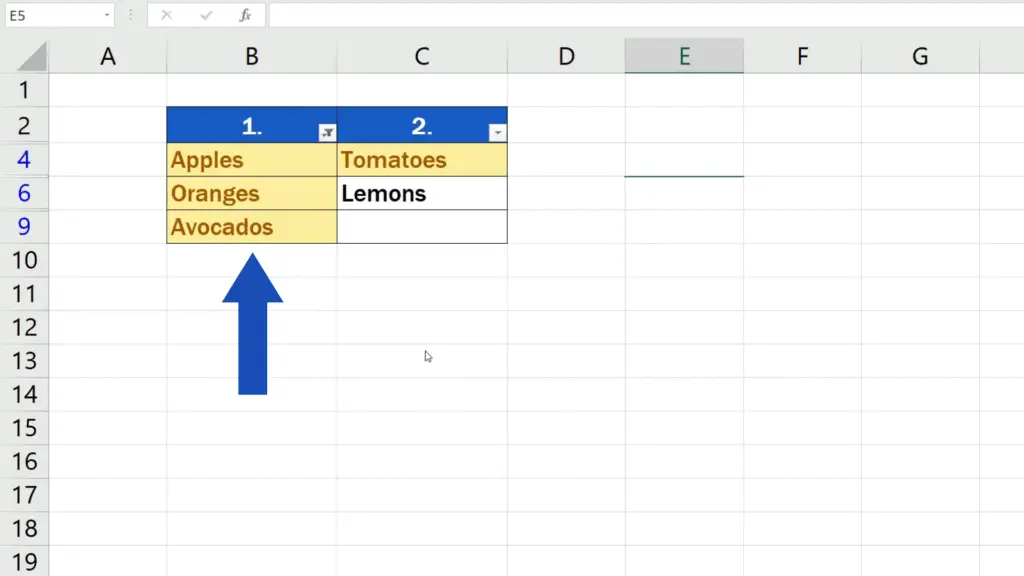
You do the same if you need to filter out only the duplicates – simply use the option ‘Sort by Color’ again to have the duplicates displayed all together.
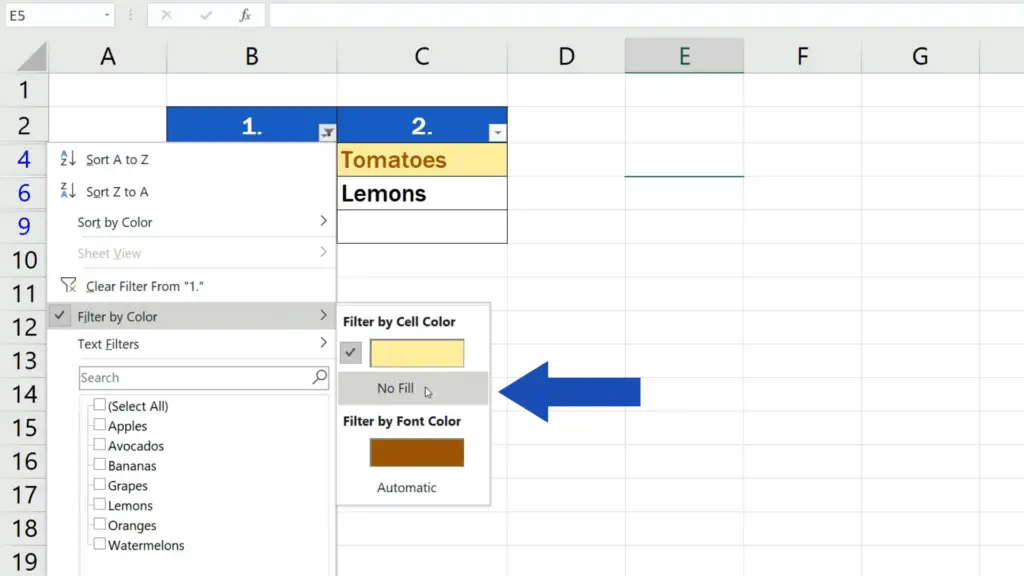
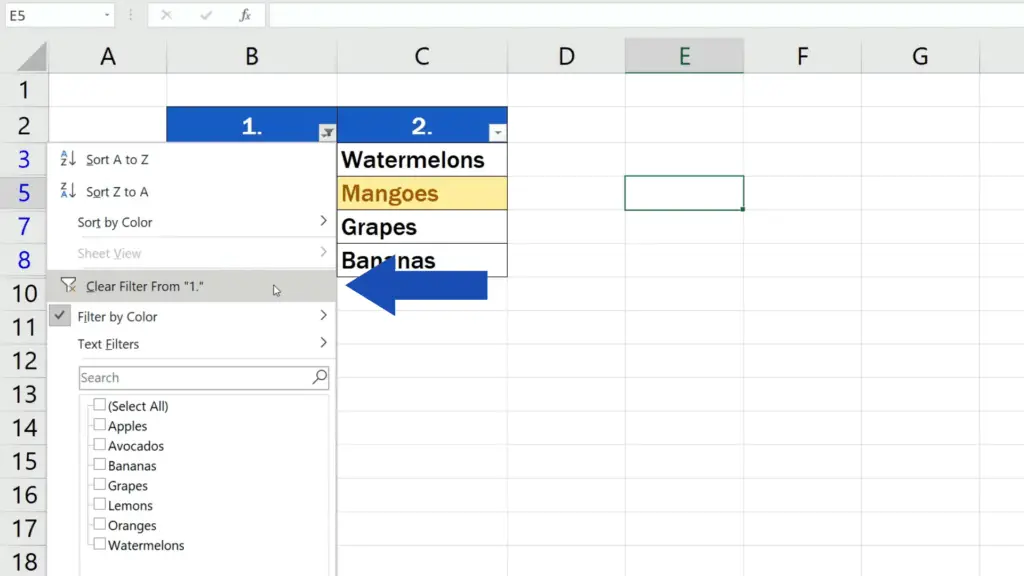
To display all the values unsorted, click on ‘Clear Filter’ and the column will show all values again.
How to Remove the Filter Completely
To remove the filter completely, go again to the Home tab, click on ‘Sort & Filter’ one more time and unselect the option ‘Filter’.
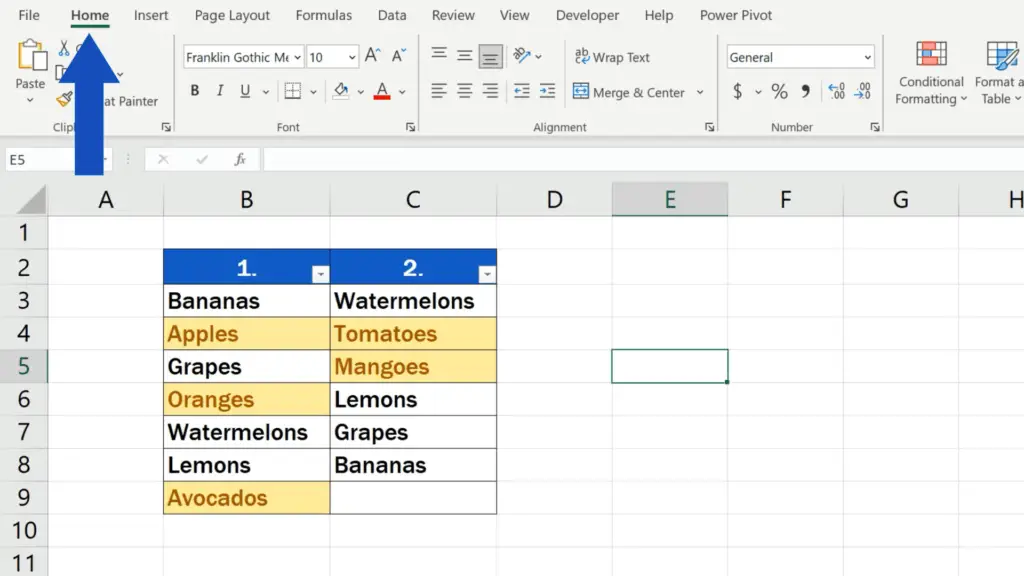
And that’s all it takes! The Filter option has been removed.
And before we wrap it up, there’s one more thing worth mentioning.
How to Remove to Highlighted Data
If you need to remove the highlighting we used for the unique values, it’s pretty simple.
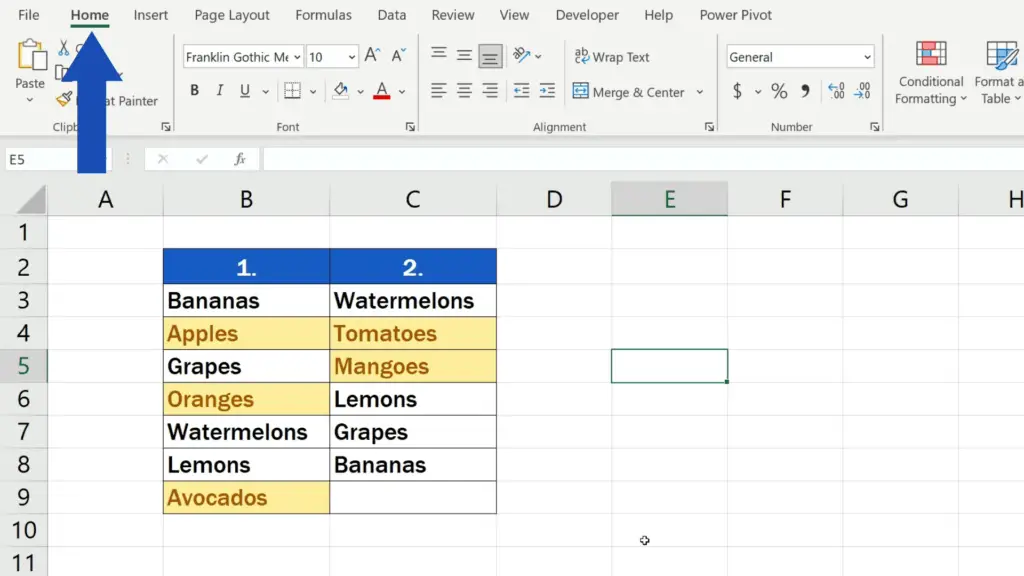
Go to the Home tab once again, click on ‘Conditional Formatting’ and choose the option ‘Clear Rules’ where you can click on ‘Clear Rules from Entire Sheet’.
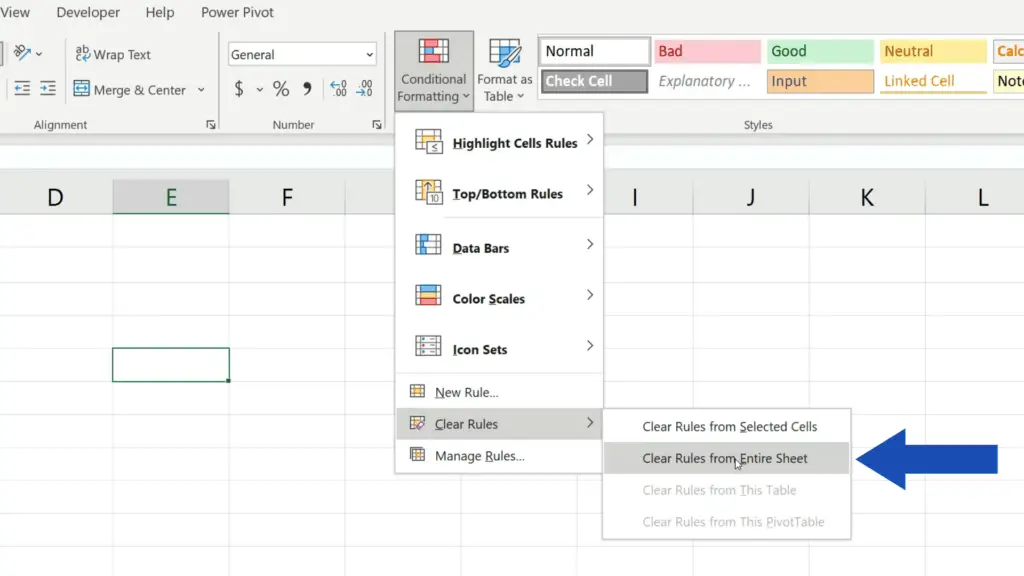
Highlighting in the columns will disappear completely and the data table looks exactly as it did at the beginning.
Don’t miss out a great opportunity to learn:
- How to Use the VLOOKUP Function in Excel (Step by Step)
- How to Highlight Blank Cells in Excel (Conditional Formatting)
- Try out Data Bars in Excel for clear graphical data representation
If you found this tutorial helpful, give us a like and watch other tutorials by EasyClick Academy. Learn how to use Excel in a quick and easy way!
Is this your first time on EasyClick? We’ll be more than happy to welcome you in our online community. Hit that Subscribe button and join the EasyClickers!
Thanks for watching and I’ll see you in the next tutorial!


